Appendix : Electron contrast dlc vs Au
The backscatter contrast ratio between the metal grid features and the silicon substrate was assessed from the electron detector intensity profiles. A higher contrast ratio indicates greater separation between the metal signal and the background, which is the primary functional requirement of the resolution standard for SEM calibration use.
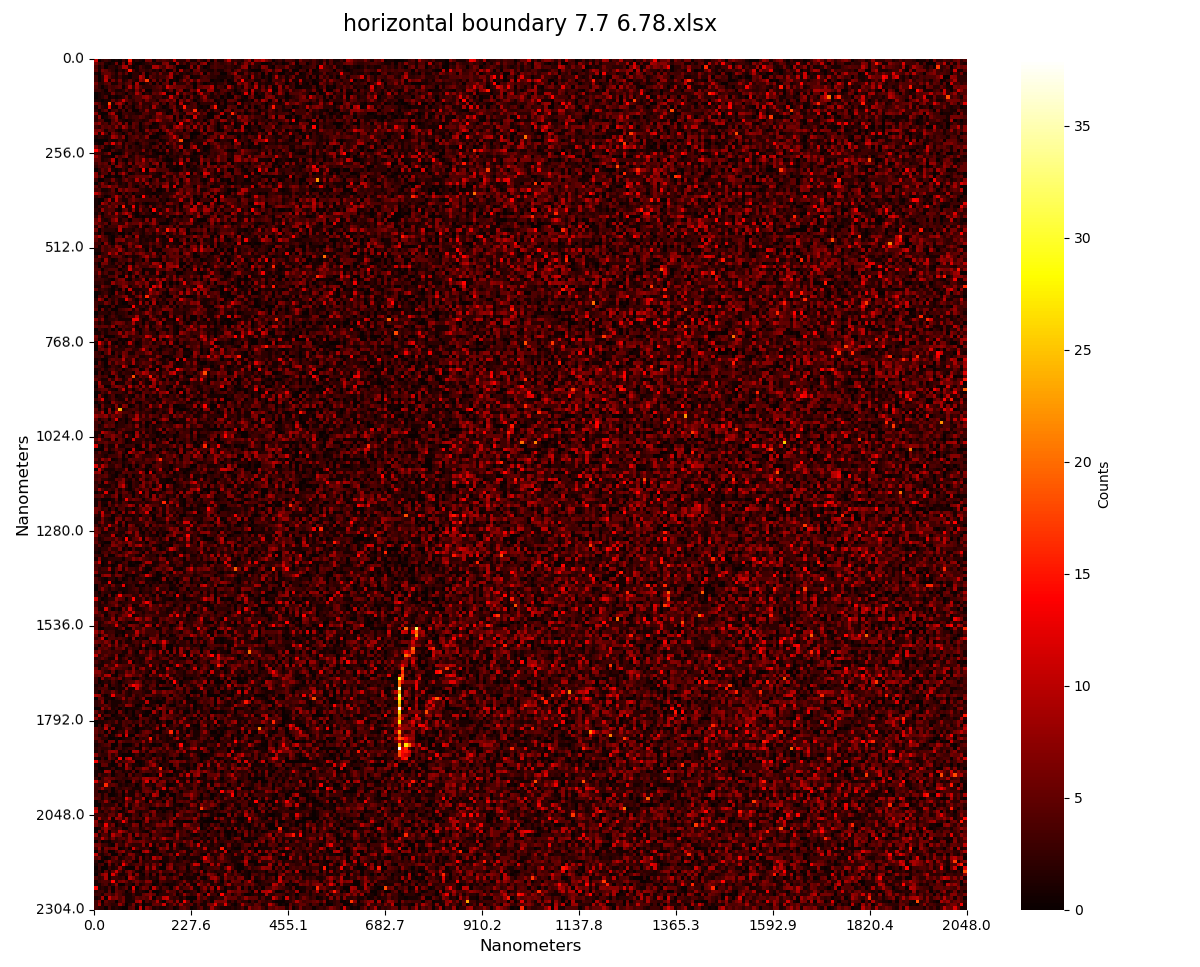
Electron contrast was assessed from 256 x 256 pixel electron count maps acquired for the Au and DLC samples. Each pixel value represents the number of backscattered or secondary electrons detected at that position during the scan. A higher mean count indicates greater electron yield from the surface, which translates to a brighter signal and better contrast against the silicon substrate in the final calibration image.
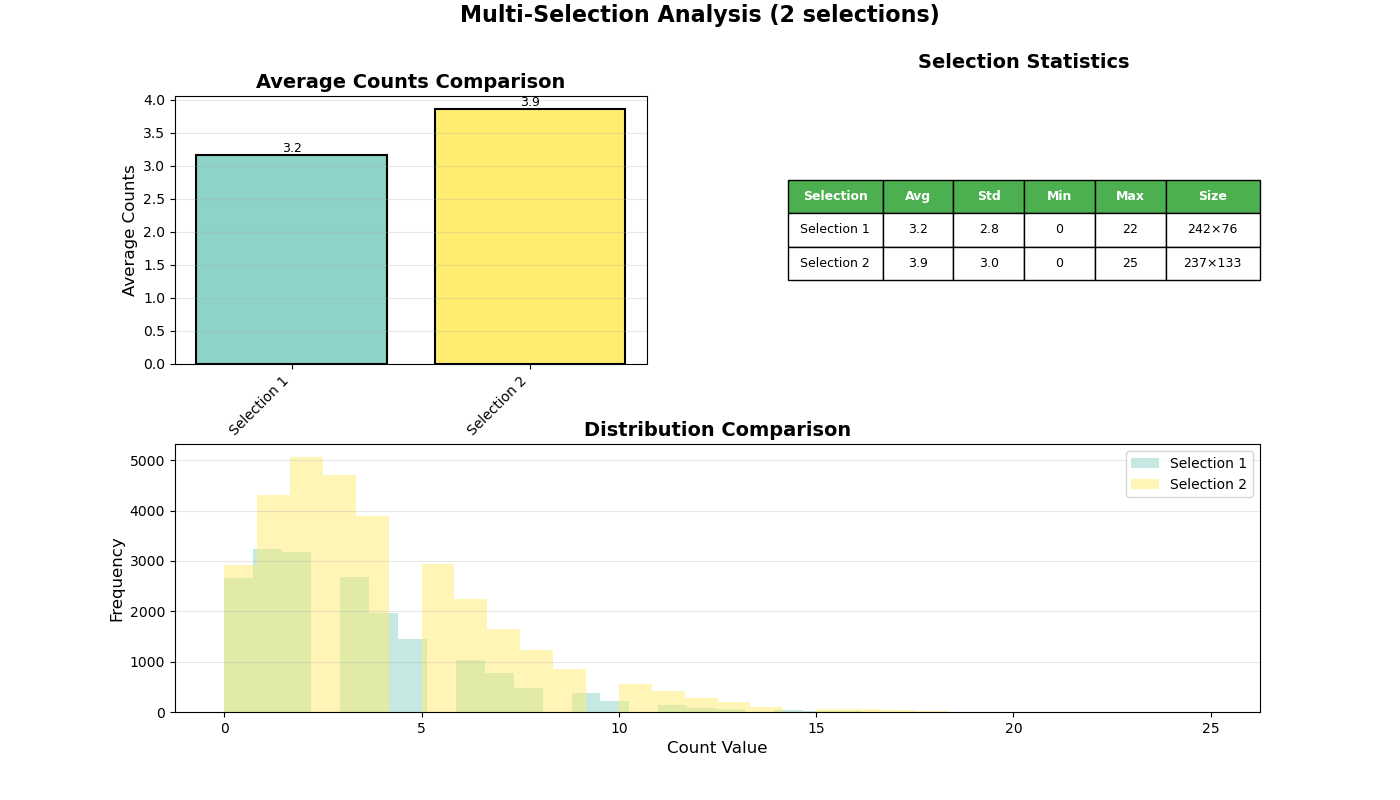
Au produces a mean electron count of 3.9 e/px compared to 3.2 e/px for DLC, giving a contrast ratio of 1.22. Gold (Z = 79) has a substantially higher backscatter coefficient than carbon (Z = 6) and should in principle yield significantly more signal per unit area. The modest ratio of 1.22, rather than the order-of-magnitude difference expected from Z alone, is due to the thin DLC film thickness used: at 5 to 10 nm, the DLC layer is thin enough to allow partial electron transmission into the underlying substrate, diluting the contrast difference.
| ← Prev: Appendix E | Next: Appendix F → |